Because of some political turmoil, fuel prices have increased over the past few weeks globally. As a response, Germany adapted the law, where fuel prices may only be increased once a day at exactly 12:00 pm, however decreasing is possible at any time. Following these rules, fuel prices should be the cheapest at 11:59 am. But this is a very inconvenient time, since literally everybody is at work at the middle of the day.
This is why I wanted to find out whether there are other sensible times to fill the tank, so of course, I’ve built a dashboard in Grafana to monitor the prices of my local fuel stations!
Instead of only seeing the current price of a fuel station (like most of them only allow you to see on their official website), I can compare historical prices and make predictions on when the best time would be to get the cheapest fuel.
But how did I make this possible without them even providing an API or similar?
Building a simple Prometheus-native website-scraper
First of all, I decided, that I only wanted to monitor fuel stations of the brand Classic. From manual observation, they have always been the cheapest ones in my area, and there’s multiple of them around me. They also have their prices on their website always up-to-date, so we can work with that (e.g. Hamburg’s Classic website). Luckily, each fuel station’s website is using the exact same layout.
Using that information, my idea was to build a simple scraper, that pulls the prices in regular intervals.
I use axios to pull a given fuel station’s website. I made the fuel stations configurable via an environment variable, so I could theoretically expand my collected data at any time.
Every fuel station has an URL in the same schema: https://www.classic-oil.de/tankstellen/${fuelStation}/, where ${fuelStation} usually resembles classic-tankstelle-${location}.
The prices can always be found in a wrapper with a class called tankstellen-preise-top. This wrapper has two children per fuel-type: Once a div with the class tankstellen-preise-produktname to hold the product name, and another div with the class tankstellen-preise-preis, where the corresponding price is shown.
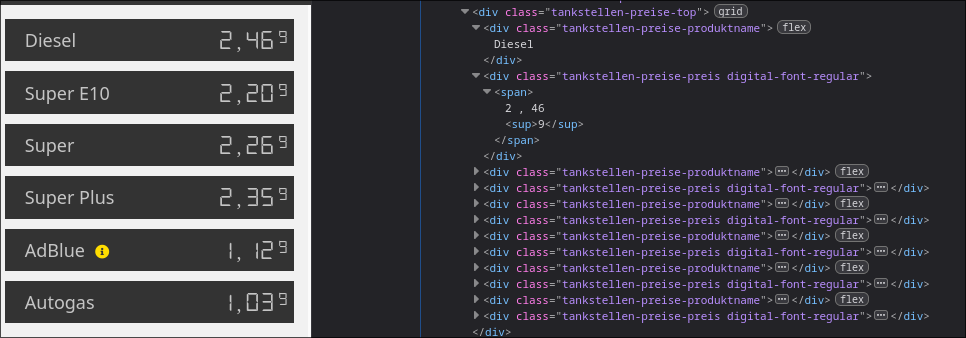
Next, I iterate over all of these children. Each product and its price get recorded and sent to a gauge from Prometheus.
Prometheus is metrics-focused-alternative to OpenTelemetry, providing a more simple approach to collecting the data. I’m already quite familiar with Prometheus, hence I chose it. For the integration in node, I chose prom-client (GitHub), which held everything quite rudimentary in my opinion.
The name of the product and the value from fuelStation get set as labels for the metric. The actual number that gets set in the gauge is the price.
All of this repeats a configurable amount of time, though I set it to 15 minutes as a default as to not run into any issues regarding rate-limiting.
const fetchPrices = async () => {
    fuelStations.forEach(async (fuelStation) => {
        const res = await axios.get(`https://www.classic-oil.de/tankstellen/${fuelStation}/`);

        const $ = cheerio.load(res.data);

        const allPrices = $(".tankstellen-preise-top");

        let price: number = -1;
        let productName: string = "";

        allPrices.children().each((i, el) => {
            if (el.attribs.class.includes("tankstellen-preise-preis")) {
                price = Number.parseFloat($(el).text().replaceAll(" ", "").replaceAll("\n", "").replaceAll(",", "."));
                console.log(new Date(), ",", fuelStation, ":", productName, ",", price);
                gauge.set({ fuelType: productName, location: fuelStation }, price)
            }
            else {
                productName = $(el).text().trim();
            }
        })
    });

    setTimeout(fetchPrices, 1000 * 60 * refreshTime);
}
Last but not least, I provide the metrics via a small HTTP-Server. Whenever my /metrics endpoint gets accessed, I get the latest values from the gauges for all possible combinations of fuel types and locations. This way, I only gather the data from the gauge when I really need it. They simply get returned as text/plain in the usual Prometheus-format:
const server = createServer(async (req, res) => {
    if (req.url == '/metrics' && req.method == 'GET') {
        res.writeHead(200, {
            'content-type': register.contentType
        });
        res.end(await register.metrics());
    }
    else {
        res.writeHead(400);
        res.end();
    }
});
The output for the endpoint then looks as follows:
# HELP fuel_price The current fuel price
# TYPE fuel_price gauge
fuel_price{fuelType="Diesel",location="classic-tankstelle-hamburg"} 2.369
fuel_price{fuelType="Super E10",location="classic-tankstelle-hamburg"} 2.189
fuel_price{fuelType="Super",location="classic-tankstelle-hamburg"} 2.249
fuel_price{fuelType="Super Plus",location="classic-tankstelle-hamburg"} 2.339
fuel_price{fuelType="AdBlue",location="classic-tankstelle-hamburg"} 1.129
fuel_price{fuelType="Autogas",location="classic-tankstelle-hamburg"} 1.039
fuel_price{fuelType="Diesel",location="classic-tankstelle-bocholt"} 2.349
fuel_price{fuelType="Super E10",location="classic-tankstelle-bocholt"} 2.169
fuel_price{fuelType="Super",location="classic-tankstelle-bocholt"} 2.229
fuel_price{fuelType="Super Plus",location="classic-tankstelle-bocholt"} 2.319
The infrastructure behind everything
The scraper above gets published as a dedicated docker container via a GitHub Workflow. This way, I can easily access it from my docker-compose setup on my Raspberry Pi.
Alongside this scraper, I also have a Prometheus-container and a Grafana-container. The Prometheus scrapes the /metrics endpoint once every minute, which Grafana then can access.
For the containers to actually be able to talk to each other, I have put them inside their own virtual network.
This is part of my docker-compose.yml:
services:
  grafana:
    image: grafana/grafana:latest
    container_name: grafana
    user: '1000'
    ports:
      - 3000:3000
    volumes:
      - ./grafana-config/data:/var/lib/grafana
    restart: unless-stopped
    networks:
      - monitoring

  prometheus:
    image: prom/prometheus:latest
    container_name: prometheus
    ports:
      - 9090:9090
    command:
      - "--config.file=/etc/prometheus/config.yml"
    volumes:
      - ./prometheus-config:/etc/prometheus/
    restart: unless-stopped
    networks:
      - monitoring

  classic-fuel-scraper:
    image: schneidermaster/classic-fuel-scraper:latest
    container_name: classic-fuel-scraper
    environment:
      - FUEL_STATIONS=classic-tankstelle-hamburg classic-tankstelle-bocholt
    restart: unless-stopped
    networks:
      - monitoring

networks:
  monitoring:
    driver: bridge
As you can see, I’ve kept everything rather simple. In the classic-fuel-scraper, you can see that I’ve provided a few fuel stations via the environment variable FUEL_STATIONS as an example.
Now that all of the above containers are in the same virtual network, Prometheus can access the scraper as follows (snippet from my prometheus config.yml):
global:
  scrape_interval: 15s
  scrape_timeout: 10s

scrape_configs:
  - job_name: classic-fuel-scraper
    scrape_interval: 1m
    static_configs:
      - targets:
        - 'classic-fuel-scraper:8080'
Note that because of a very cool internal DNS-resolution of docker, I only need to write down the container name and the port number as the target URL.
Building a coherent dashboard for these metrics
Now that I had all of the data that I needed, I was able to build a dashboard. After adding Prometheus as a datasource in Grafana (also just through prometheus:9090 as an URL), I started building.
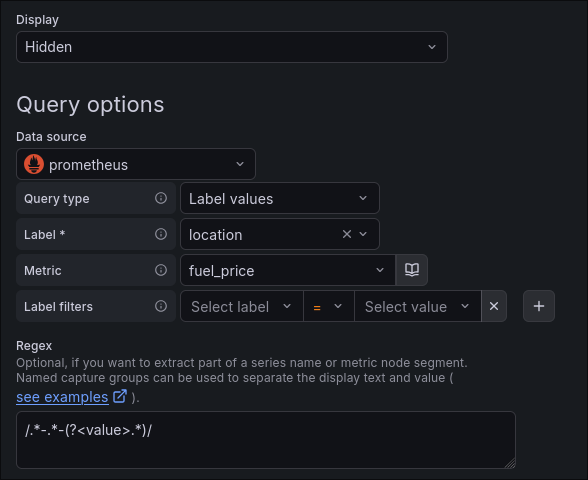
Since there could theoretically be an infinite amount of fuel stations, I made the dashboard function around a dynamic variable. With a query that targets the location label of my metric, I am able to extract all available fuel stations. I also just get the real location by only getting the string after the last hyphen:
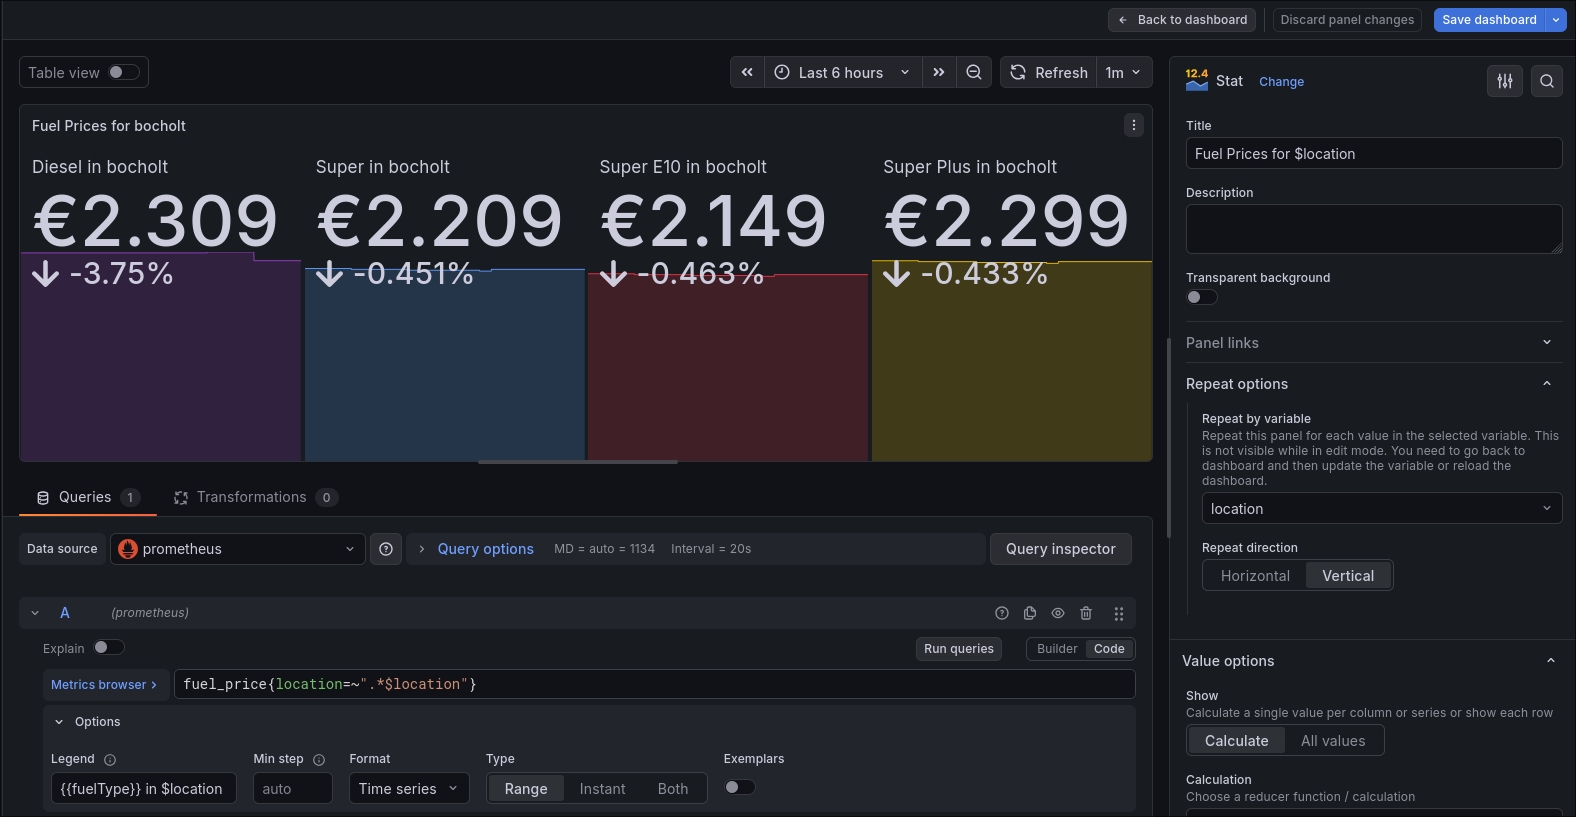
On the panels themselves, which I will talk about in a brief moment in detail, I have set this variable as the repeat-value. This means, that for each unique value of the variable, the panel gets repeated (in this case vertically). I can also use the variable now, to only get the data for that location. As you can see, I am using it in the query, the legend and the title of the panel:
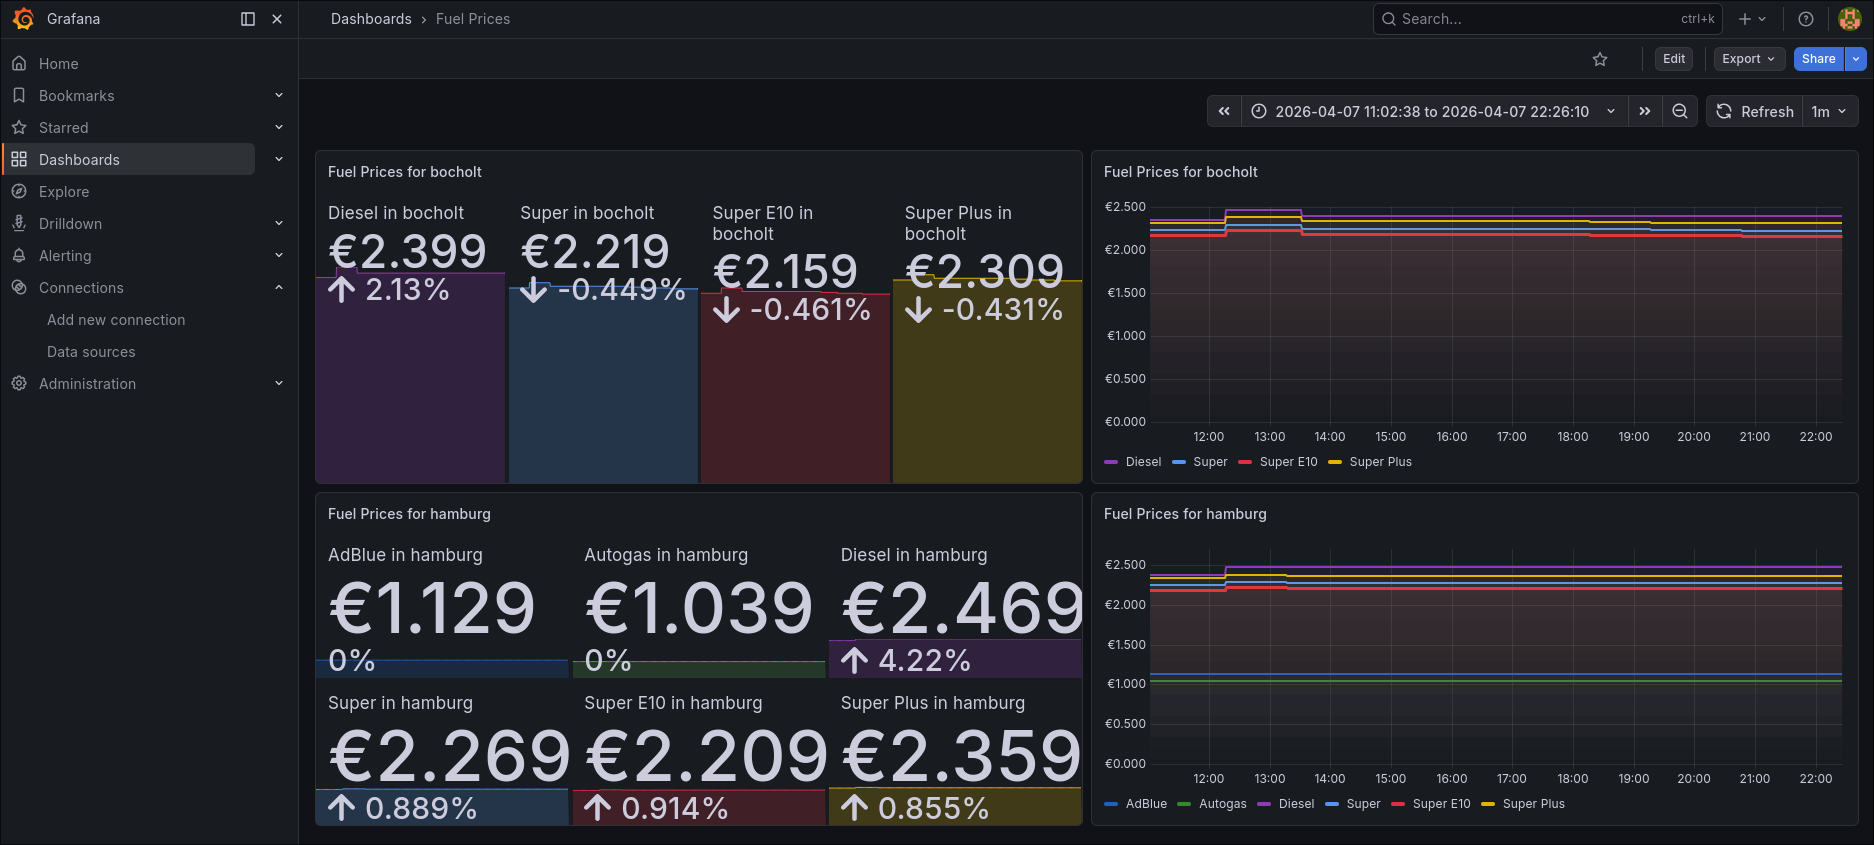
I’ve applied both of these settings to two separate panels. One of them displays the current price of each product (as you would see on the website) with how much it has changed during the selected time span. The other one shows a graph, where you can see how the price has developed over time.
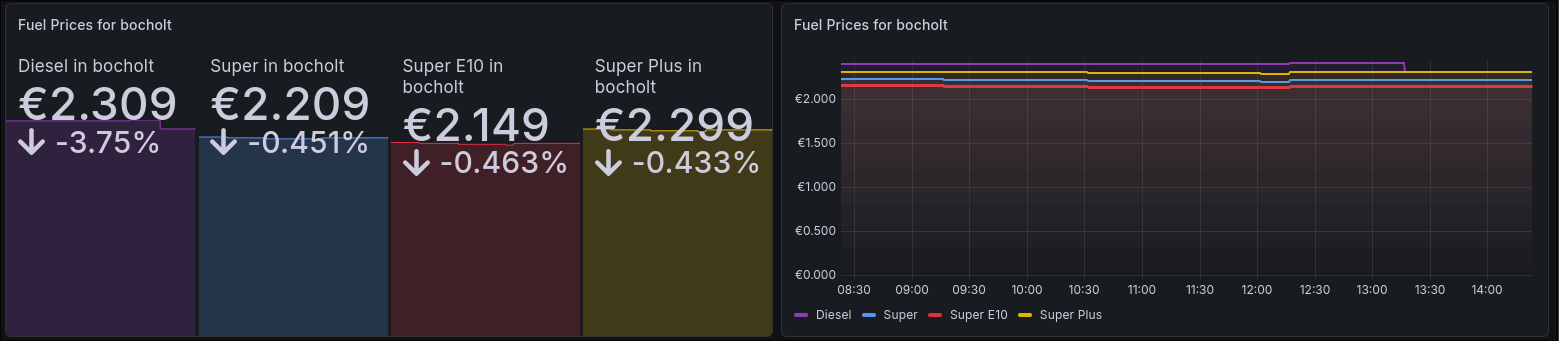
Note that I am using the same colors for the same fuel type across each of the panels for a better and easier differentiation.
Overall, I am able to make good predictions about the price and see in general how it develops over time and which fuel station is the cheapest in my area at any given moment.
Closing Words:
I am quite happy with how this turned out. Everything operates on the simple side and doesn’t cost much performance (I have already seen dashboards that can crash an entire Grafana instance because of poor performance!). Of course, you would probably still be better off, just looking at a more general fuel price website, where all fuel stations in an area are listed, not just the ones from a particular brand. However, my solution doesn’t rely on crowd-sourcing, which I am very proud of, since I don’t really trust it and it doesn’t give data as fast as my solution.
Also, my scraper will likely break, if the owners of Classic will decide to revamp their website one day, but adapting to that shouldn’t be that big of a hassle.
If you’ve found my post helpful or would like to add your opinion on it, feel free to message me on LinkedIn. I am always open to new perspectives on established solutions.
All of the code as well as the dashboard can be found on my GitHub.